A Bus Is Budgeted by the Hour
A passenger sees buses by departure time. A transit budget needs hours across a whole fleet, and it has to say which hours count as service.
In this story 5 sections
A bus that appears at seven forty in the morning may have been part of somebody’s schedule for considerably longer than the people boarding it realize. It left a place where it was stored. A driver has been working. For a while the bus was going somewhere without taking passengers. Later there may be a little time at the end of the line to recover from a delay. The passenger’s timetable offers an answer to a precise question: when can I meet the bus? The budget has a more expansive question: how much service and supporting work has been put into making that appointment possible?
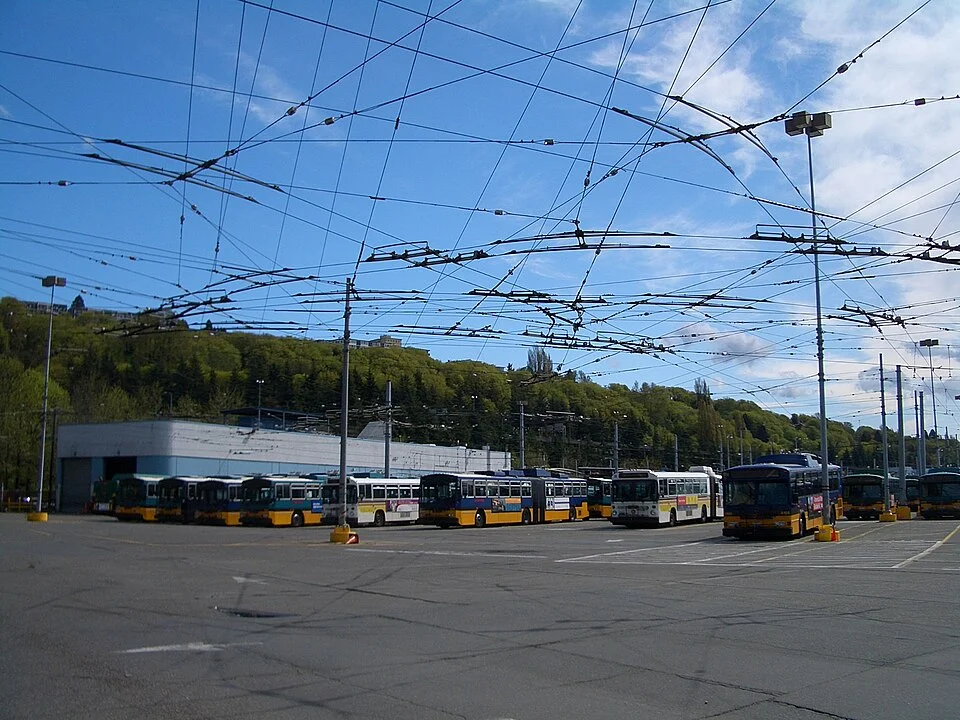
The same word, hour, can describe several parts of that answer. Hours when vehicles are assigned to passenger service are different from hours when drivers are paid or from the number of hours for which a line is open on the map. They can move in different amounts when an agency makes a change. A useful account names the thing being counted in front of every hour. The photo of buses at a Seattle base gives that distinction a physical place. The garage and the road both belong to public transportation, but not every movement between them appears on the route timetable.
Count the bus, not the length of the whole day
Imagine a made-up route on which two buses operate for the same six-hour block. If both have six revenue hours under the reporting convention we choose, that gives twelve vehicle revenue hours in the block. It does not make the route available for twelve successive hours. The two buses were taking up capacity at the same time. If a third were added for two of those hours, the result would be fourteen vehicle-hours counted under the same assumptions. You might make more departures available without moving the time of the first or last departure at all.
This becomes easy to miss in comparisons between two lines. One might run in the same narrow period with many buses coming in succession. Another might have fewer departures spread over a longer span. The total vehicle-hours could be similar. Someone trying to get home in the evening may still have very different options. Someone adding the workload across the fleet should not mistake the span of the timetable for the summed vehicle-hours. A well-chosen table can keep those two useful totals side by side without having them compete for one column.
A vehicle may have an assigned period of service that includes some layover according to a stated convention. The Federal Transit Administration’s National Transit Database describes vehicle revenue hours with a distinction between eligible layover or recovery time and movement without passenger service, often called deadhead. This is a reporting definition. Use the applicable rules to interpret a particular agency’s report rather than assigning every minute a vehicle stands still to one category. Some standing time helps deliver a workable service. Other time represents a movement or task outside the hours counted under that definition.
The hour can begin away from the passenger route
An imagined vehicle leaves its depot and travels for twenty-five minutes to the place where it will start its scheduled service. Later it finishes service at another point and needs twenty minutes to get to the appropriate depot. The extra forty-five minutes do not have to be part of its passenger timetable. An agency still has to have a driver and vehicle for them. Distance, traffic and the location of compatible facilities can influence the work involved. A budget that takes account of only the minutes advertised to riders can miss ordinary activity that happens at the beginning and end.
That relationship changes if the network is arranged differently. A depot nearer one end of a route might make shorter non-passenger runs possible, while farther-away facilities can have advantages for the rest of the network. A bus that finishes one trip and proceeds to serve another route may depend on a small connecting movement or enough time to get there. It would be a mistake to assume every service hour added requires the same distance to a depot. It would also be a mistake to assume no new supporting time is required because the depot already exists.
Make a small flow drawing from parking to the first stop, into passenger service and then from its end to the next assigned work. Use a distinct mark for time in each kind of motion. Add any pause that belongs in the service plan, with the appropriate definition. The drawing tells you almost instantly why a staff member should ask which bus, route and starting point a new trip needs. A list of departures without that context can look easier to extend than it actually is.
An average is useful when it names its job
Take a fictional agency that reports $720,000 of operating expense for a set of services in a period with 9,000 reported vehicle revenue hours. Dividing gives $80 per such hour in this example. That is a reasonable summary of how the chosen total relates to the amount of reported service. It does not establish that removing one isolated hour would save $80. An operator shift, maintenance arrangements or support costs may continue. In another plan a relatively small addition crosses a threshold and requires a new shift or another vehicle for the busiest part of the day.
The opposite assumption can mislead as well. If an extra bus is already scheduled nearby and can fit a short extension into work that would otherwise be idle, the marginal cost might be comparatively small. If the fleet has no capacity at that time, the same length of extension may be difficult to provide. The decisions that make the agency’s average a true number are spread over many routes and periods. An estimate of changing one service has to identify precisely what could change in the affected schedule.
For comparisons across systems, check the expense categories, the service reported and the time period. A difference in a ratio could reflect a difference in the amount of supporting work, the way service is arranged or the applicable operating costs. It may also reflect a discrepancy in the things the two figures cover. The federal database provides a set of definitions for its own reporting. Having common names is valuable for making comparisons possible, but people still need to look at what is actually present in the relevant data and the seasons or conditions those records represent.
Four buses do not set a frequency by themselves
Imagine a route with a sixty-minute round trip including the necessary recovery time, and four buses spaced evenly around it. In that model a departure can come every fifteen minutes. If the cycle becomes seventy-two minutes at a busier time of day and there are still four buses, an even pattern would give a departure every eighteen minutes. Keeping fifteen-minute departures in that time window may require another bus or another change to the plan. The calculation is about a simplified cycle, not a claim that a particular agency can space every vehicle exactly as intended.
The driver and bus have to finish real movements in that time. A lagging bus may leave the next one with a smaller part of the work while riders wait much longer before it arrives. Schedule arithmetic alone cannot tell whether planned intervals are being delivered. Compare the vehicle-hour plan with observations of actual departures on the route if the question is about passenger service. Keep the two records separate even when the agency uses the same timetable to explain both.
Keep the direction in the timetable. A peak in one direction can use a fleet quite differently from equal service in both.
Give the trip its own evidence
The number of people who boarded, length of passenger journeys and patterns of waiting are different measures from the hours of service provided. They can help an agency examine whether the work delivered the result it hoped for. Two routes with equal revenue hours can serve different numbers of passengers and quite different kinds of trips. A high-boarding city route and a service giving an essential connection at a narrower time may need to be reviewed with different facts in view. A budget number has a role without turning immediately into a complete assessment of the route.
A short explanation of a proposal can therefore put three lines on one page. The first describes the intended change for riders, including when and where it occurs. The second gives the expected change in the vehicle time used to provide it, with the reporting definition attached. The third describes any other work that changed, such as fleet assignment or the time needed to reach the beginning of a route. A reader should be able to ask about the difference in one line without being sent back to the most impressive number on another.
At seven forty, the passenger may reasonably care only whether a bus stops in front of them. The agency can care about that outcome and still organize its resources with a less visible clock. Read the plan beside the timetable and you can see which parts of the hour are offered directly to a passenger and which parts had to be arranged so there would be a bus there to offer them.